


All apps

CodeScope

A native Windows front end for the scc engine.

A native Windows desktop application that analyses a codebase with the pinned, frozen scc engine and presents the result either as a rich in-app dashboard or as scc’s own self-contained HTML infographic. It never makes a network request.

Platform
Windows 10 (1809+) or Windows 11, x64
Release
v1.0.0
Licence
MIT
Size
11 MB portable · 68 MB installer
CodeScope — 1.0.0
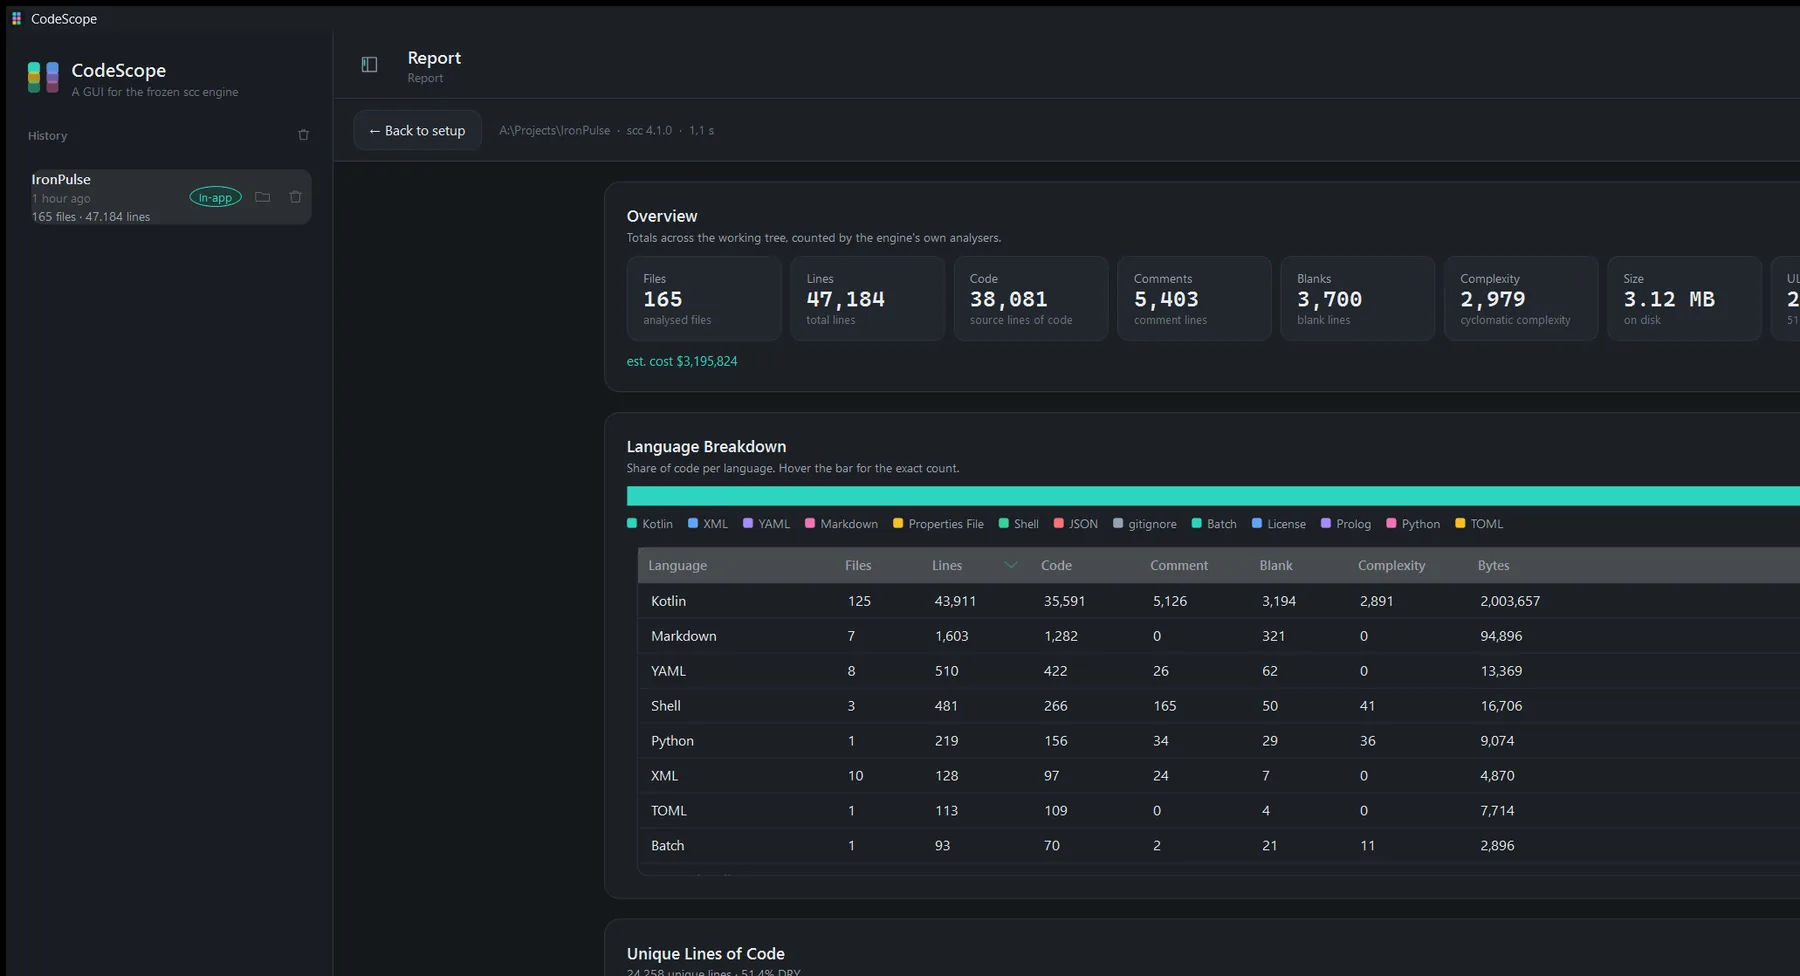
The CodeScope in-app report dashboard on Windows, showing the overview metric cards and the language breakdown table.

CodeScope 1.0.0 — in-app report

Why it exists

Measuring a codebase should not need a toolchain, a runtime and a terminal window.

CodeScope bundles the scc engine — frozen at a known commit, with its hashes recorded — so that measuring a codebase is a matter of picking a folder and pressing a button. The result is a readable dashboard rather than a wall of terminal output, every optional section has a switch that actually works, and the whole thing never touches the network.

  • Developers

    Metric cards, a language breakdown, a searchable per-file table and hotspots you can jump straight to.

  • Teams and reviewers

    Authors, bus factor, change coupling and timelines, taken from real Git history.

  • People who need to share a number

    Export one self-contained HTML infographic, written wherever you choose.

What it does

The parts that actually matter.

Every screen below is the released application. The numbers, the tools and the behaviour described are the ones you will find in the build.

01 — Setup

Point it at a folder and choose what the report should contain

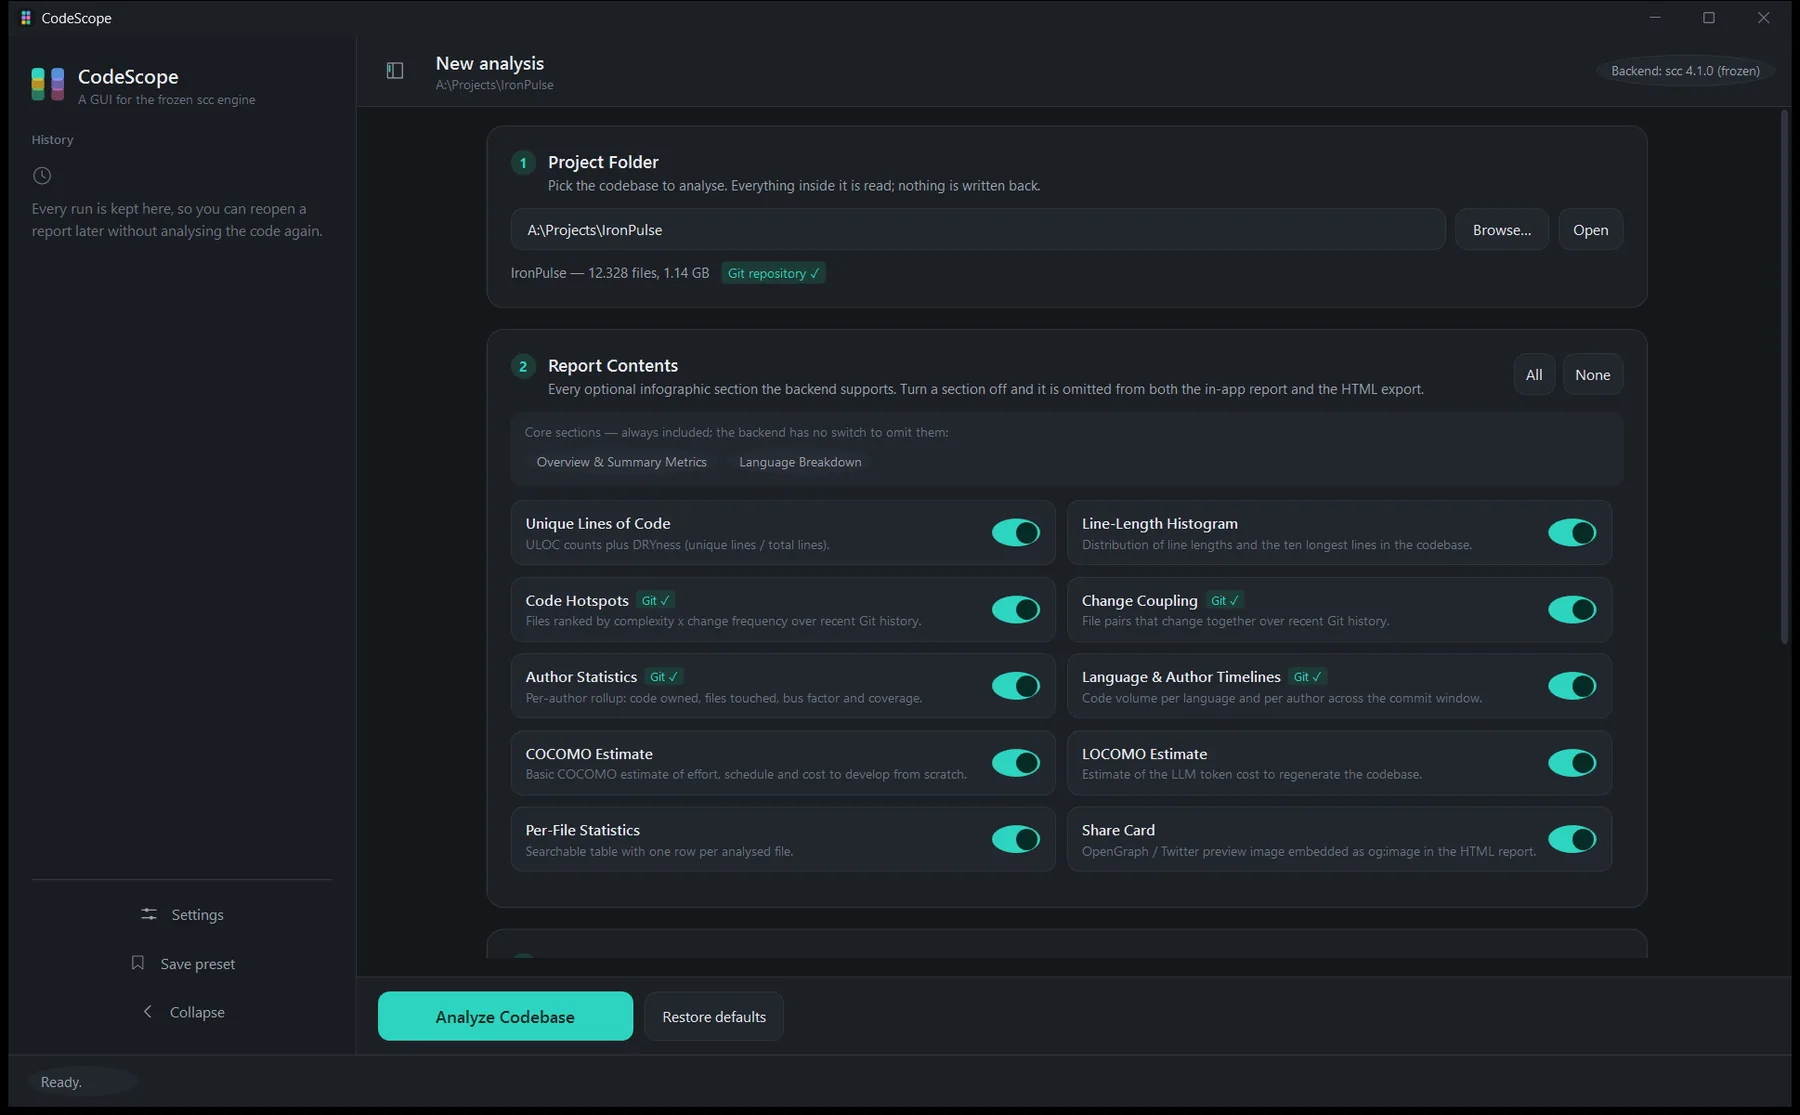
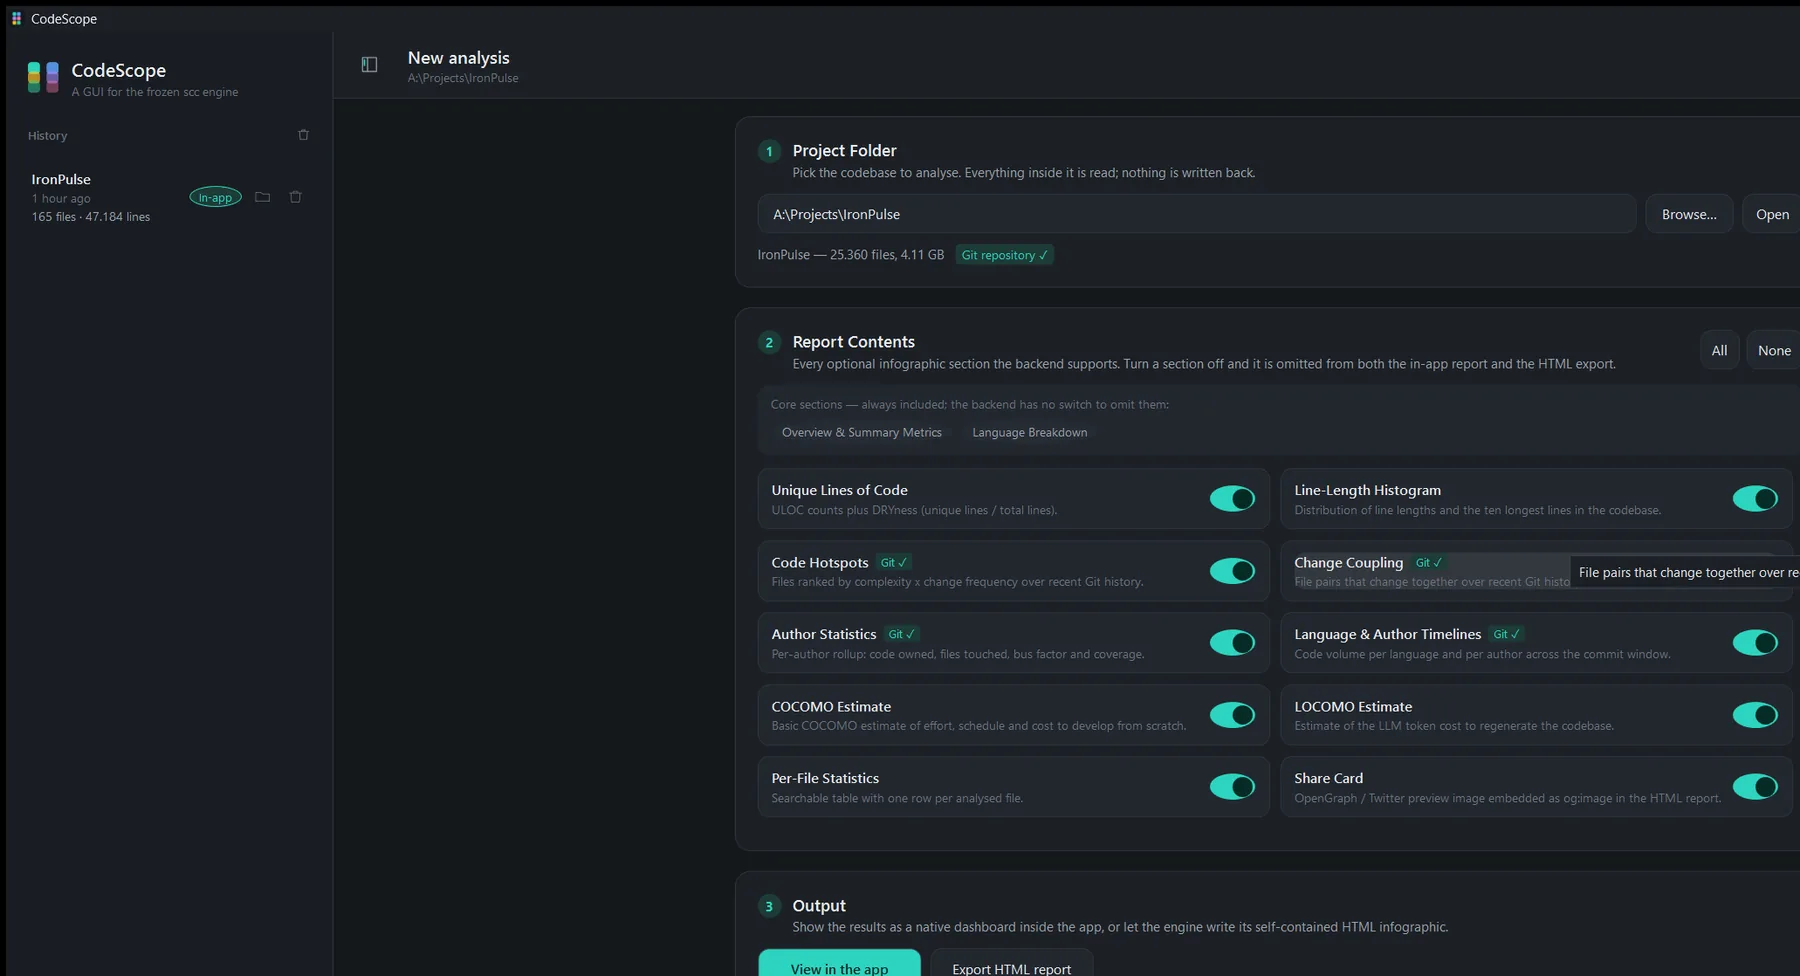
CodeScope opens on the analysis setup screen. Browse to a folder with the native Windows picker — the app validates it and tells you whether it lives inside a Git repository. Then choose the report contents: every optional section the pinned backend supports has its own switch, and turning one off omits it from both output modes. The section really is absent, never merely hidden.

  • The native Windows folder picker, with validation
  • Git repository detection, shown next to the folder
  • A switch for every optional report section
  • Fine tuning for ignores, extension filters, large-file limits, minified and generated detection, language remapping, ULOC, cognitive complexity, COCOMO and LOCOMO parameters, Git window depth and worker tuning
CodeScope — Setup
The CodeScope analysis setup screen showing the project folder and the report content switches.

02 — The report

A dashboard, not a wall of numbers

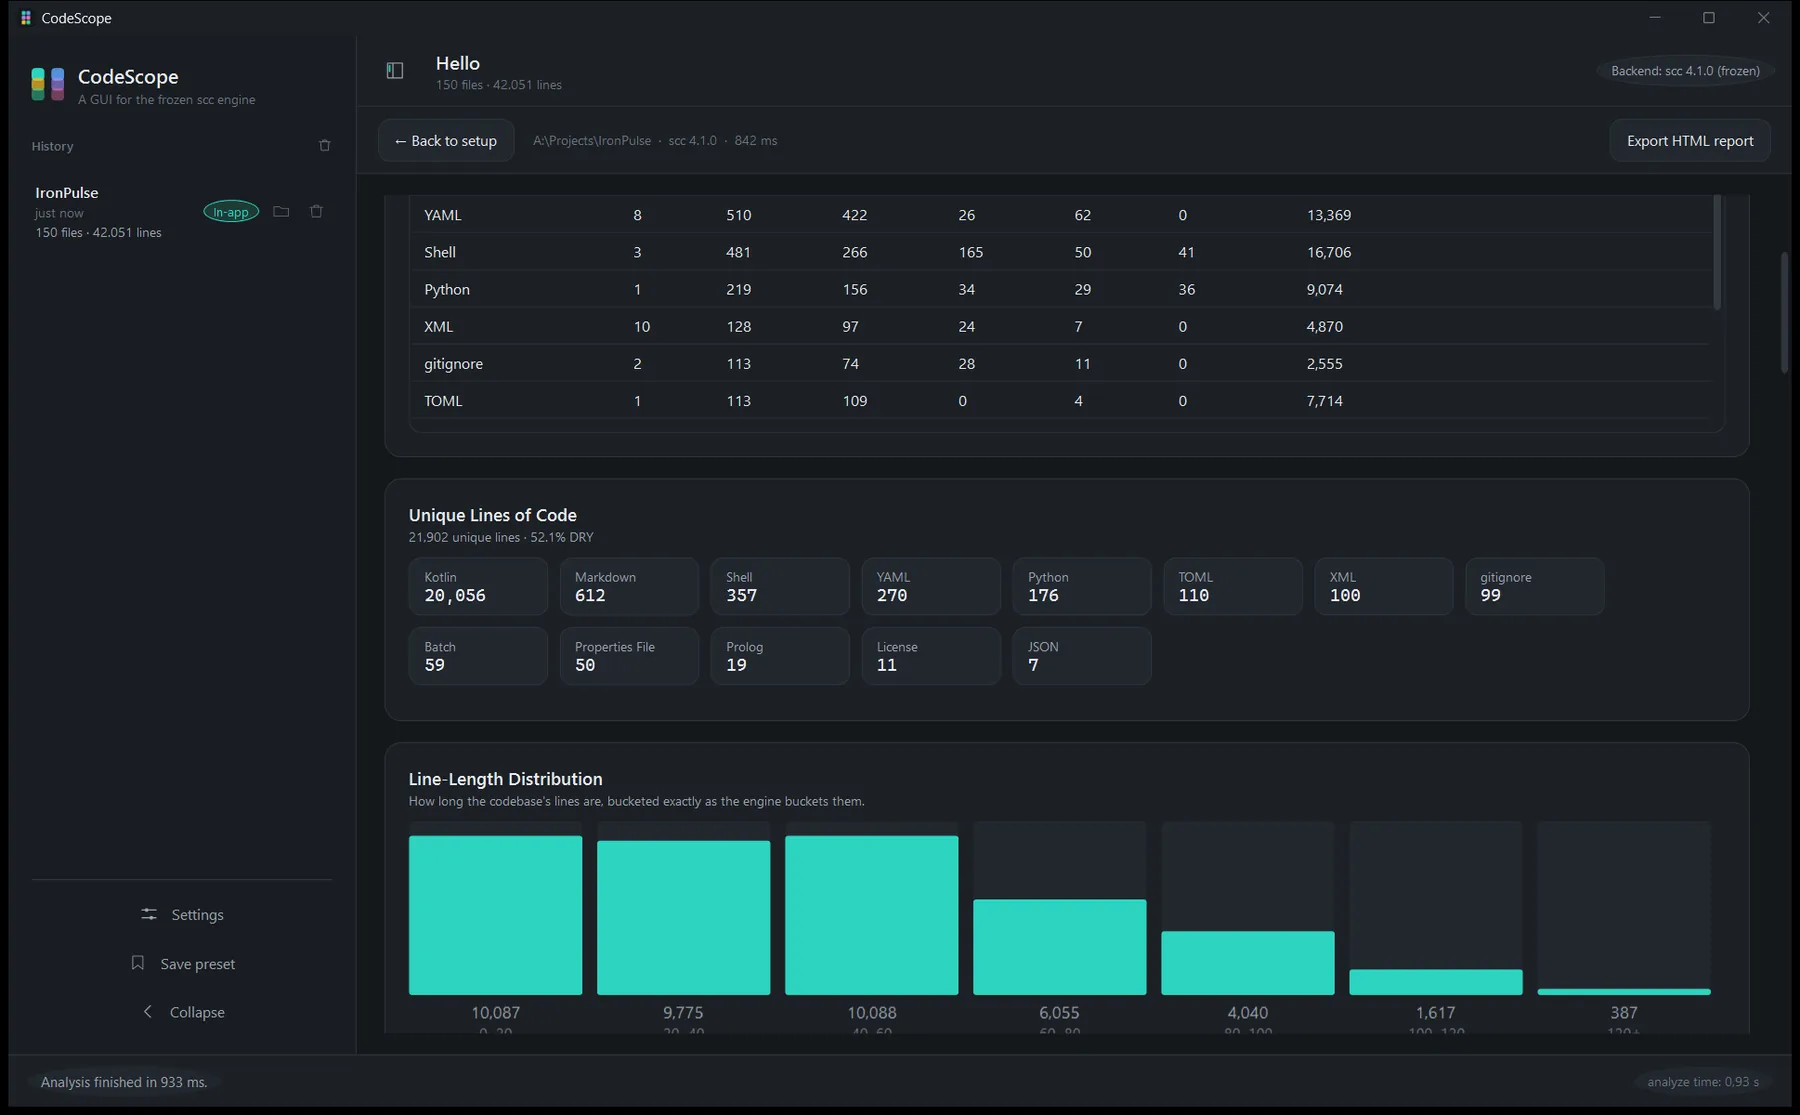
The in-app report is a sequence of readable cards and tables: the summary metrics, a language distribution bar with the exact counts, the line-length histogram, the hotspot and change-coupling tables, the author rollup with its bus factor, the language and author timelines, the cost models and a searchable per-file table. Every table sorts by its column headings, and the sorted heading carries an arrow that points the way the rows run.

  • Metric cards for files, lines, code, comments, blanks, complexity, size and an estimated build cost
  • Language distribution with a sortable table underneath
  • Unique lines of code (ULOC) and DRYness
  • Per-file statistics in a searchable table
CodeScope — The report
The CodeScope in-app report dashboard showing the overview metric cards and the language breakdown table for the IronPulse codebase.

03 — History

Every finished run is kept, and can be reopened as it was

Each run is stored in the application-data folder with the folder that was analysed, the totals, the timing and the engine’s own report data. The sidebar lists them; click one to reopen that report exactly as it was produced, without running the engine again. The last thirty runs are kept, so the folder cannot grow without bound.

  • One JSON file per run in %LOCALAPPDATA%\CodeScope\history
  • Reopen a stored report without re-running the analysis
  • A hard cap of thirty entries
  • A damaged file never hides the rest of the history
CodeScope — History
A full CodeScope analysis report showing the metric cards, language breakdown and per-file statistics.

04 — Export

One self-contained HTML file, written where you choose

Type a report file name, choose the output folder with the native picker, and run the analysis. “Save as” remembers the name and confirms it inline, and an existing file is never replaced without an explicit confirmation. Exporting from the report itself opens a small themed dialog that asks for the file name and the folder; leaving the folder empty writes the report beside the analysed code.

  • scc’s own self-contained HTML infographic
  • The in-app report writes nothing at all
  • An existing file is never overwritten without confirmation
  • A share card for social preview images, unless switched off
CodeScope — Export
The CodeScope configuration view with the report section switches and the analysis options.

05 — In the details

Double-click a row and the file is in File Explorer

In any file-bearing table — per-file statistics, longest lines, code hotspots or change coupling — double-clicking a row opens that file in File Explorer, and in the coupling table it is the file under the pointer that wins. When the folder is not inside a Git repository, the four history sections say so on their toggle and the report explains which sections could not be produced. Nothing is invented.

  • Per-file statistics, longest lines, hotspots and coupling, all clickable
  • Sections that need Git are marked when the folder has no repository
  • Empty history data is shown as empty, never fabricated
  • Themes resolve through DynamicResource, so switching re-skins the dashboard immediately
CodeScope — In the details
The CodeScope report dashboard with its sortable tables and metric cards.

How it is used

A short path from open to done.

  1. 01

    Choose a folder

    Browse to the codebase with the native picker. CodeScope validates it and tells you whether it is inside a Git repository.

  2. 02

    Choose the report

    Switch the sections you want on or off, and fine-tune the analysis: ignores, extension filters, complexity models, Git depth and worker tuning.

  3. 03

    Analyse

    The bundled, frozen engine does the work. The status bar names the real phase it is in.

  4. 04

    Read and export

    Read the dashboard, sort any table, double-click a row to open a file — or export one self-contained HTML infographic to share.

At a glance

The details, up front.

Platform
Windows 10 (1809+) or Windows 11, x64
Latest release
v1.0.0
Runtime
.NET 8 Desktop Runtime (x64) required
Licence
MIT
Engine
scc 4.1.0, frozen at commit 36b4729
Network
None — the app never phones home

Built with

  • .NET 8
  • WPF
  • Go (scc 4.1.0, frozen)
  • No NuGet packages

Privacy & offline

What leaves your device.

Nothing here is a marketing promise — it is what the application is built to do.

  • The app makes no network request of any kind.
  • Nothing about the analysed codebase leaves the machine.
  • Settings and history live in %LOCALAPPDATA%\CodeScope, never inside an analysed project.
  • The app never writes to the folder you analyse.
Read the source and the licence

Get CodeScope

Try it on your own device.

The latest build is published on GitHub Releases with a checksum file next to it. The source is public, and the whole thing is free of accounts, adverts and trackers.